A breakdown by local area of the percentage of people likely to test positive for coronavirus.
18 March 2022
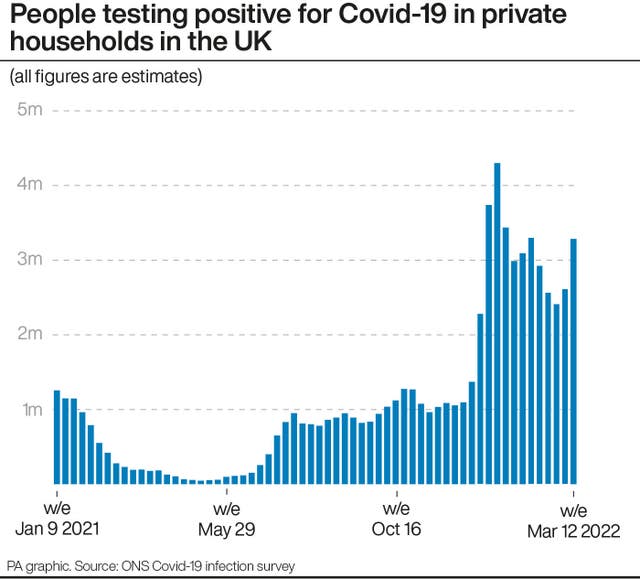
Here are the latest estimates of Covid-19 prevalence in local authority areas in the UK, according to the Office for National Statistics (ONS).
All figures are calculated as an average over the seven days to March 12 2022 and refer to infections among people in private households.
The estimates are based on sample sizes that are smaller than those used for the national and regional figures. This means there is more uncertainty around the figures and caution should be taken when interpreting or ranking them, the ONS said.
The figures are grouped by regions in England, followed by Scotland, Wales and Northern Ireland. In each group, the list is ordered by prevalence of Covid-19, starting with the highest.
The information reads, left to right: name of local authority, percentage of people in private households testing positive for Covid-19 over the seven days to March 12; the estimated ratio of people with Covid-19.
North-east England
– Newcastle upon Tyne 5.43% (1 in 18)
– North Tyneside 4.61% (1 in 20)
– Northumberland 3.35% (1 in 30)
– Hartlepool; Middlesbrough; Redcar & Cleveland; Stockton-on-Tees 3.22% (1 in 30)
– Gateshead; South Tyneside; Sunderland 3.09% (1 in 30)
– County Durham; Darlington 2.66% (1 in 40)
North-west England
– Wirral 4.93% (1 in 20)
– Knowsley; Liverpool; Sefton; West Lancashire 4.7% (1 in 20)
– Bury; Burnley; Hyndburn; Pendle; Rossendale 4.51% (1 in 20)
– Tameside 4.5% (1 in 20)
– Rochdale 4.49% (1 in 20)
– Stockport 4.36% (1 in 25)
– Blackpool; Fylde; Lancaster; Preston; Ribble Valley; South Ribble; Wyre 4.22% (1 in 25)
– Cheshire East 4.15% (1 in 25)
– Halton; Warrington; Trafford 4.06% (1 in 25)
– Manchester 3.94% (1 in 25)
– Salford 3.84% (1 in 25)
– Allerdale; Barrow-in-Furness; Carlisle; Copeland; Eden; South Lakeland 3.67% (1 in 25)
– Blackburn with Darwen; Bolton; Chorley 3.48% (1 in 30)
– Oldham 3.36% (1 in 30)
– St. Helens; Wigan 3.21% (1 in 30)
– Cheshire West & Chester 3.12% (1 in 30)
Yorkshire & the Humber
– Sheffield 5.86% (1 in 17)
– Kingston upon Hull 5.08% (1 in 20)
– York 4.8% (1 in 20)
– Craven; Hambleton; Harrogate; Richmondshire; Ryedale; Scarborough; Selby 4.75% (1 in 20)
– Leeds 4.12% (1 in 25)
– East Riding of Yorkshire 3.87% (1 in 25)
– Wakefield 3.75% (1 in 25)
– Kirklees 3.67% (1 in 25)
– Barnsley 3.43% (1 in 30)
– Bradford 3.39% (1 in 30)
– Doncaster; North East Lincolnshire; North Lincolnshire; Rotherham 3.28% (1 in 30)
– Calderdale 2.8% (1 in 35)
East Midlands
– Corby; Daventry; East Northamptonshire; Kettering; Northampton; Rutland; South Northamptonshire; Wellingborough 5.41% (1 in 18)
– Ashfield; Bassetlaw; Broxtowe; Gedling; Mansfield; Newark and Sherwood; Rushcliffe 5.05% (1 in 20)
– Blaby; Charnwood; Harborough; Hinckley and Bosworth; Melton; North West Leicestershire; Oadby and Wigston 5.03% (1 in 20)
– Amber Valley; Bolsover; Chesterfield; Derbyshire Dales; Erewash; High Peak; North East Derbyshire; South Derbyshire 4.57% (1 in 20)
– Boston; East Lindsey; Lincoln; North Kesteven; South Holland; South Kesteven; West Lindsey 4.56% (1 in 20)
– Derby 4.56% (1 in 20)
– Nottingham 4.34% (1 in 25)
– Leicester 2.83% (1 in 35)
West Midlands
– Bromsgrove; Dudley; Redditch 5.22% (1 in 19)
– Cannock Chase; East Staffordshire; Lichfield; Newcastle-under-Lyme; South Staffordshire; Staffordshire Moorlands; Tamworth 4.43% (1 in 25)
– Wolverhampton 4.35% (1 in 25)
– North Warwickshire; Nuneaton and Bedworth; Rugby; Stratford-on-Avon; Warwick 4.21% (1 in 25)
– Herefordshire; Malvern Hills; Worcester; Wychavon; Wyre Forest 4% (1 in 25)
Sandwell 3.94% (1 in 25)
– Telford and Wrekin; Stoke-on-Trent; Stafford 3.92% (1 in 25)
– Solihull 3.91% (1 in 25)
– Coventry 3.84% (1 in 25)
– Birmingham 3.83% (1 in 25)
– Walsall 3.67% (1 in 25)
– Shropshire 3.06% (1 in 35)
Eastern England
– Suffolk Coastal; Waveney 6.28% (1 in 16)
– Babergh; Forest Heath; Ipswich; Mid Suffolk; St Edmundsbury; Tendring 5.91% (1 in 17)
– Peterborough 5.18% (1 in 19)
– Broxbourne; Dacorum; East Hertfordshire; Hertsmere; North Hertfordshire; St Albans; Stevenage; Three Rivers; Watford; Welwyn Hatfield 5.11% (1 in 20)
– Braintree; Chelmsford; Colchester; Maldon; Rochford; Southend-on-Sea; Uttlesford 4.93% (1 in 20)
– Breckland; Broadland; Great Yarmouth; King’s Lynn and West Norfolk; North Norfolk; Norwich; South Norfolk 4.73% (1 in 20)
– Basildon; Brentwood; Castle Point; Epping Forest; Harlow; Thurrock 4.36% (1 in 25)
– Cambridge; East Cambridgeshire; Fenland; Huntingdonshire; South Cambridgeshire 4.22% (1 in 25)
– Bedford; Central Bedfordshire; Luton 3.73% (1 in 25)
London
– Sutton 7.48% (1 in 13)
– Lambeth 7.11% (1 in 14)
– Hammersmith & Fulham; Kensington & Chelsea; Westminster 6.56% (1 in 15)
– Southwark 6.56% (1 in 15)
– Enfield 6.34% (1 in 16)
– Hounslow 6.26% (1 in 16)
– Waltham Forest 5.91% (1 in 17)
– Tower Hamlets 5.71% (1 in 18)
– Wandsworth 5.71% (1 in 18)
– Ealing 5.52% (1 in 18)
– City of London; Hackney; Islington 5.36% (1 in 19)
– Bromley 5.3% (1 in 19)
– Newham 5.27% (1 in 19)
– Redbridge 5.22% (1 in 19)
– Greenwich 5.14% (1 in 19)
– Kingston upon Thames; Merton; Richmond upon Thames 5.09% (1 in 20)
– Croydon 5.09% (1 in 20)
– Havering 4.99% (1 in 20)
– Lewisham 4.82% (1 in 20)
– Hillingdon 4.58% (1 in 20)
– Haringey 4.55% (1 in 20)
– Harrow 4.42% (1 in 25)
– Camden 4.34% (1 in 25)
– Bexley 4.34% (1 in 25)
– Brent 4.24% (1 in 25)
– Barking & Dagenham 4.24% (1 in 25)
– Barnet 4.21% (1 in 25)
South-east England
– Eastbourne; Hastings; Lewes; Rother; Wealden 7.08% (1 in 14)
-Cherwell; Oxford; South Oxfordshire; Vale of White Horse; West Berkshire; West Oxfordshire 6.68% (1 in 15)
– Medway 6.63% (1 in 15)
– Elmbridge; Epsom and Ewell; Guildford; Mole Valley; Reigate and Banstead; Tandridge; Waverley; Woking 6.37% (1 in 16)
– Canterbury; Dover; Swale; Thanet 6.18% (1 in 16)
– Brighton and Hove 6.05% (1 in 17)
– Adur; Arun; Chichester; Crawley; Horsham; Mid Sussex; Worthing 5.95% (1 in 17)
– Basingstoke and Deane; East Hampshire; Eastleigh; Fareham; Gosport; Havant; Isle of Wight; New Forest; Test Valley; Winchester 5.52% (1 in 18)
– Hart; Reading; Rushmoor; Wokingham; 5.19% (1 in 19)
– Ashford; Dartford; Folkestone and Hythe; Gravesham; Maidstone; Sevenoaks; Tonbridge and Malling; Tunbridge Wells 5.19% (1 in 19)
– Portsmouth 5.07% (1 in 20)
– Southampton 4.83% (1 in 20)
– Milton Keynes 4.63% (1 in 20)
– Bracknell Forest; Runnymede; Slough; Spelthorne; Surrey Heath; Windsor and Maidenhead 4.28% (1 in 25)
– Aylesbury Vale; Chiltern; South Bucks; Wycombe 3.71% (1 in 25)
South-west England
– Cornwall; Isles of Scilly 6.9% (1 in 14)
– Cheltenham; Cotswold; Forest of Dean; Gloucester; Stroud; Tewkesbury 6.67% (1 in 15)
– Plymouth; South Hams; Torbay 5.23% (1 in 19)
– Bournemouth; Poole; Christchurch 5.08% (1 in 20)
– Bath and North East Somerset; Bristol; North Somerset 4.81% (1 in 20)
– East Dorset; North Dorset; Purbeck; West Dorset; Weymouth and Portland 4.79% (1 in 20)
– Swindon 4.78% (1 in 20)
– Mendip; Sedgemoor; South Somerset; Taunton Deane; West Somerset 4.76% (1 in 20)
– Wiltshire 4.07% (1 in 25)
– East Devon; Exeter; Mid Devon; North Devon; Teignbridge; Torridge; West Devon 3.71% (1 in 25)
– South Gloucestershire 3.59% (1 in 30)
Scotland
– North Lanarkshire; South Lanarkshire 7.94% (1 in 13)
– East Dunbartonshire; East Renfrewshire; Glasgow; Inverclyde; Renfrewshire; West Dunbartonshire 7.81% (1 in 13)
– Dumfries & Galloway; East Ayrshire; North Ayrshire; Scottish Borders; South Ayrshire 7.20% (1 in 14)
– Angus; Clackmannanshire; Dundee; Falkirk; Fife; Perth & Kinross; Stirling 7.16% (1 in 14)
– Aberdeen; Aberdeenshire; Argyll & Bute; East Lothian; Edinburgh; Highland; Midlothian; Moray; Na h-Eileanan Siar; Orkney Islands; Shetland Islands; West Lothian 6.09% (1 in 16)
Wales
– Bridgend; Merthyr Tydfil; Rhondda Cynon Taf 4.57% (1 in 20)
– Cardiff; Vale of Glamorgan 4.06% (1 in 25)
– Neath Port Talbot; Swansea 4.02% (1 in 25)
– Blaenau Gwent; Caerphilly; Monmouthshire; Newport; Torfaen 4.03% (1 in 25)
– Conwy; Denbighshire; Flintshire; Gwynedd; Isle of Anglesey; Wrexham 3.74% (1 in 25)
– Ceredigion; Carmarthenshire; Pembrokeshire; Powys 3.43% (1 in 30)
Northern Ireland
(Figures for Northern Ireland have been calculated by health trust area rather than local authority)
– Southern Health & Social Care Trust 7.33% (1 in 14)
– Western Health & Social Care Trust 7.25% (1 in 14)
– Belfast Health & Social Care Trust 7.23% (1 in 14)
– Northern Health & Social Care Trust 7.07% (1 in 14)
– South Eastern Health & Social Care Trust 6.93% (1 in 14)